


- 更新时间:2025-03-04 15:26
所属行业:IT 软件 教学管理软件 -
发货地址:北京海淀
信息编号:266357571,公司编号:14832749
产品规格:不限
产品数量:9999.00 套
包装说明:不限
产品单价:面议
官方网址:http://turntech8843.b2b168.com/
- 18510103847 王经理
- 留言数:94人
- 查看数:42人
正规代理_visual modflow软件教程软件怎么用
- 相关产品:
Visual
- 所在区域:北京海淀
- 经营性质:私有企业
- 企业类型:商业服务
- 注册地:北京
- 主营产品:pscad,gams,spsspro,stata,matlab,mathematica,nvivo
- 企业已认证
- 个人实名未认证
- 产品分类
- 商家其他产品推荐
- 产品详细信息
科学软件网提供的软件上千款,涉及所有学科领域,您所需的软件,我们都能提供。科学软件网提供的软件涵盖领域包括经管,仿真,地球地理,生物化学,工程科学,排版及网络管理等。同时,还提供培训、课程(包含34款软件,66门课程)、实验室解决方案和项目咨询等服务。
Define complex geology and model layers using borehole log data and cross-sections
Interpret GIS data to define hydrogeologic properties and boundaries independent of the grid
Run, analyze, and validate model results with raw data in 2D, 3D, and cross-section views
The following MODFLOW-6 flow packages are supported in Visual MODFLOW Flex:
Simulation Packages:
NAM – Simulation Name File
TDIS – Time Discretization
IMS – Iterative Model Solution
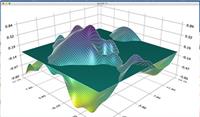
强大的数据可视化功能
新三维可视化技术的构建与设计,Visual MODFLOW Flex 让您的水文地质模型给人印象深刻的视觉效果,并允许您有效地向同事和利益相关者展示和交流您的数据。
可视化所有的数据,包括的2D,3D和多视图(Flexviewer)显示的概念对象、计算网格、数据输入(属性区域、边界条件单元格)和输出数据(计算上端、迹线、水位)
创建切割和横截面视图,并让您在模型中查看
为报表或Web生成3D动画和电影
添加等值线、等高线,迹线和色差到阅读器中
在三维表面上叠加栅格图像(站点地图,卫星图像)以显示浮雕效果
优化OpenGL图形以增强硬件渲染
有效管理多个模型
大多数建模项目涉及几个场景/版本,例如,稳态与瞬态、不同的属性、输入和网格类型。Visual MODFLOW Flex通过对多种建模场景的比较和分析,您可以评估不确定性,并提高模型的可信性。
在单个项目中管理多个模型场景
易于并行生成多个模型用于评估替代水文地质解释和假设
在不同的建模场景之间进行直观的和数字的比较
计算具有相同或不同网格大小的多个模型运行时的头差异
比较和分析多种建模场景,以选择佳、接近现实的模型
Build credible models
With integrated modeling, model inputs and outputs can be easily visualized alongside raw GIS field data in 3D. This allows you to establish model credibility by demonstrating how numerical model data (model layers, flow parameters, recharge data) were generated from conceptual data (borehole logs, GIS data). Calculated heads and pathlines can also be displayed alongside conceptual model data to validate assumptions and further demonstrate model credibility.
Easily compare multiple models
Visual MODFLOW Flex’s unique design permits easy side-by-side comparisons of multiple models allowing you to assess alternative modeling scenarios, grid indiscretions and hydro-geologic interpretations
Define complex geology and model layers using borehole log data and cross-sections
Interpret GIS data to define hydrogeologic properties and boundaries independent of the grid
Run, analyze, and validate model results with raw data in 2D, 3D, and cross-section views
Easily create multiple conceptualizations; generate numerous grids and model scenarios in parallel all in a single project
Assess uncertainty though comparing heads from multiple model runs in 2D, 3D or chart views
科学软件网不定期举办各类公益培训和讲座,让您有更多机会免费学习和熟悉软件。
- 商家联系方式
- 我要给商家留言
- 商家产品推荐


- 相关产品推荐
-
深圳沙井深圳空调维护保养公司 清洗换油
白山韩国LS产电GMD-12
烟台特训教育咨询效果 思图教育教育咨询
供应商 锥形混合机 二手锥体混合机
乌海到衢州物流公司服务好
山西一叶观音神像批发
长期供应 锥形混合机 闲置二手双螺旋混合机
桂林夏威夷果回收
孝感筒瓦销售 造型别致
geneious授权码 保证正版
塘沽区做环氧地坪漆施工 免费勘察现场
长春博大教育辅导班 长春钢琴培训班一对一那家好 长春博大教育
天河区废锡回收厂家联系方式/天河区废电缆回收厂家
不伤苗的玉米除草剂 恩施玉米苗后除草剂直供
开封四分类垃圾桶厂家 城韵设施批发零售 垃圾桶户外
临汾腐熟纯鸡粪 果蔬底肥
磐安本地发电机租赁公司
唐山AAA信用评级加分申请周期 企业银行信用评级加分流程攻略
青浦区高新申报办理条件有那些 免费咨询
一手货源 铜雕神像厂家
净水药剂 聚合氯化铝液体厂家