


- 2025-03-07 15:26 4094
- 产品价格:面议
- 发货地址:北京海淀 包装说明:不限
- 产品数量:9999.00 套产品规格:不限
- 信息编号:266167288公司编号:14832749
- 王经理 微信 18510103847
- 进入店铺 在线留言 QQ咨询 在线询价
保证正版 grapher软件如何用
- 相关产品:
北京天演融智软件有限公司(科学软件网)前身是北京世纪天演科技有限公司,成立于2001年,专注为国内高校、科研院所和以研发为主的企事业单位提供科研软件和服务的国家。
Manager
The Manager allows you to work with automation within Grapher
rather than opening Golden Software's automation program, Scripter,
separately. All of Scripter's functionality is available within the
Manager. Right-click in the Manager to access Scripter's menu
commands.
By default, the Manager is not displayed. Click the View | Display
| Manager or Automation | Manager | View
Manager command to show or hide the Manager. A check mark
indicates the manager is visible. No check mark indicates the manager is
hidden. When the Manager is displayed, the default location is
tabbed with theWorksheet Manager.
值得信任的解决方案
Grapher受到全球数以千计的科学家、和商业的信任。他们信任Grapher并用它展示数据。
功能
创建的图表
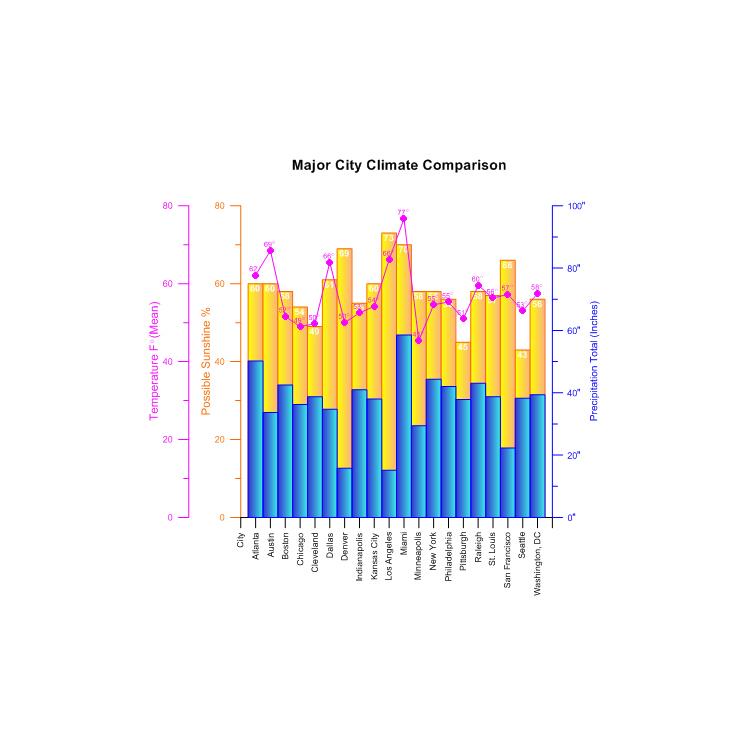
快速创建令人惊叹的信息丰富的2D和3D图形。有超过70个不同的图表类型并使用Grapher已有的图表功能来展现您的数据。
好的展现数据
把您图形的每个方面都控制在小的细节上。Grapher广泛的定制选项让您以易于理解的方式传达复杂的想法。Grapher以佳的方式展现数据。
Grapher定制选项
添加图例、标题和坐标轴
包括插入缩放或图形放大镜
编辑所有轴参数,多轴
格式轴刻度为线性、对数、自然对数、概率或日期/时间
整合多个图形
添加拟合曲线、错误条和统计报表
将每个图形组件放置在的位置
定义自定义行样式、颜色和填充
编辑文本、行、填充和符号属性
添加文本、折线、多边形、符号和样条线
更多…….
Organize your objects in the Object Manager and edit your graphs in the Property Manager!
Create templates to use the same graph settings with multiple data files.
Save the graphs in Grapher 7, Grapher 8, Grapher 9, or Grapher 10 GRF or GPJ formats to make sharing documents between colleagues with different versions easier than ever!
Automate the graphing process with the included Scripter?.
Use the simple Recorder to record your graph making process! Play back scripts to create the graph with a single click!
Export graphs for use in presentations and publications in one of Grapher’s many export formats, including vector PDF, EMF, and EPS.
Combine multiple axes or plots to display fabulous multiple variable graphs.
Include error bars
Perform statistical calculations on the raw data
Display statistical reports
功能
创建的图表
快速创建令人惊叹的信息丰富的2D和3D图形。有超过70个不同的图表类型并使用Grapher已有的图表功能来展现您的数据。
科学软件网专注提供正版软件,跟上百家软件开发商有紧密合作,价格优惠,的和培训服务。


