


- 更新时间:2025-03-05 15:26
所属行业:IT 软件 教学管理软件 -
发货地址:北京海淀
信息编号:232639536,公司编号:14832749
产品规格:不限
产品数量:9999.00 套
包装说明:不限
产品单价:面议
官方网址:http://turntech8843.b2b168.com/
- 18510103847 王经理
- 留言数:94人
- 查看数:32人
正版软件 mapviewer正版软件云盘
- 相关产品:
- 所在区域:北京海淀
- 经营性质:私有企业
- 企业类型:商业服务
- 注册地:北京
- 主营产品:pscad,gams,spsspro,stata,matlab,mathematica,nvivo
- 企业已认证
- 个人实名未认证
- 产品分类
- 商家其他产品推荐
- 产品详细信息
科学软件网提供大量正版科学软件,满足各学科的科研要求。科学软件网专注软件销售服务已达19年,全国大部分高校和企事业单位都是我们的客户。同时,我们还提供本地化服务,助力中国的科研事业。
Make Informed Decisions
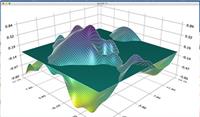
Utilize MapViewer’s geoprocessing tools to make better, more informed decisions about your spatial data. Highlight areas of interest, narrow down sections to perform further analysis, and apply mathematical calculations on the raw data to discover new insights.
MapViewer Boundary Editing Tools
Reshape, clip, smooth polylines, and polygons
Create buffers around points, polylines, and polygons
Convert between polygons and polylines
Create new polygons by combining existing polygons that overlap or share a border
Create points or polygons at areas of intersection for overlapping areas
Connect or break polylines at specified locations
Combine and split islands
MapViewer 专题制图与空间分析软件
数据可视化
充分利用您的数据。利用MapViewer丰富的专题制图和空间分析特征快速生成出版物质量图。区分数据中的模式和趋势,了解空间关系,并为客户和利益相关者提供他们需要的信息。
分析数据
为您准备数据。MapViewer为您提供了可视化和分析数据地理分布的工具,这样您就可以自信地做出决策。找到提率、创新和盈利能力的机会。MapViewer将您的数据转换为有价值的信息。
沟通结果
将数据转化为可执行的结果。MapViewer的众多地图类型和定制选项允许您轻松地与客户、利益相关者和同事交流结果。
he following is a list of boundary and data files included with MapViewer. These files are suitable for creating a wide variety of maps. You can download MapViewer’s boundary and data files from Golden Software’s web site. You can also create custom boundaries by combining existing boundaries or by using the drawing tools. MapViewer can import boundary files in several different formats so you can also use files created in other applications.
The MapViewer CD-ROM contains Golden Software entire library of data files and boundary files.
的解决方案
全球有数百人使用MapViewer来展示他们的空间数据。看看为什么有那么多人信任MapViewer来可视化他们的数据。
功能
创建的专题地图
控制您的空间数据。MapViewer强大的映射能力将空间数据转换为信息主题地图。灵活的地图显示、即时定制和分析使MapViewer成为GIS分析师、业务人员和任何处理空间分布式数据的人的工具。
增强的地图功能
创造出既智能又美观的地图。MapViewer的大量定制选项允许您创建地图来清楚地传达您的信息。
做出明智的决策
利用MapViewer的地质数据处理工具,对您的空间数据做出更好、更明智的决定。突出显示感兴趣的领域,缩小部分以执行进一步的分析,并在原始数据上应用数学计算来发现新的见解。
Density Maps
Density maps also called dot density maps, use symbols to represent data values for areas on a map. On a density map, each symbol represents some data value, so the number of symbols drawn in an area is in relation to the data values associated with that area.
Gradient Maps
Gradient maps display a continuous range of colors by interpolating between discrete data points.
Dorling Cartograms
Cartograms represent data values by changing the size of the associated area object. The Dorling cartogram replaces the original shape with a circle.
数据可视化
充分利用您的数据。利用MapViewer丰富的专题制图和空间分析特征快速生成出版物质量图。区分数据中的模式和趋势,了解空间关系,并为客户和利益相关者提供他们需要的信息。
,专注,专心是科学软件网的服务宗旨,开发的软件、传递前沿的技术、提供贴心的服务是我们用实际行动践行的至高目标,我们会为此目标而不懈努力。
- 商家联系方式
- 我要给商家留言
- 商家产品推荐


- 相关产品推荐
-
阿勒泰天猫代运营运营模式 汕头天猫代运营公司排名 效率高花费少
宝安**写字楼前城中心项目简介_宏发QCC前城中心_楼层高度高
昆山到日照物流直达 物流公司整车运输 送货上门
青海折叠楼梯厂家 折叠伸缩楼梯
不锈钢过滤机 养生酒过滤机 选用SUS304材质或316L材质
深圳金地大百汇广场|福田****写字楼大百汇广场招商中心
梅州BSCI认证咨询 办理材料
塑料行星减速机
美晶专显55/86/100寸教学会议触摸一体机会议平板教学一体机
菏泽到宜宾大巴车电话 专线大巴
pvc草坪护栏 塑钢围栏 草坪护栏 草地护栏 塑钢护栏 小区护栏 社区护栏
连云港ESEP水管除垢设备电话
DSAV110 ABB 折扣优惠
上海到亳州物流直达 货物物流配送公司 上门取件
石膏板隔断 城阳美容美发店装修公司电话 纯一层别墅
外墙玻璃改窗户_幕墙漏水换胶维修_抚州钢化玻璃维修公司
采购一批机器从中国中国的运费
法国普货进口报关常见问题 进口日常用品清关 全程门到门
深圳旧设备进口报关流程 一条龙服务
房屋修理装修公司 学校装修 半小时免费上门_现场快修
深圳BSCI认证公司 需要什么条件