

- 2025-03-07 15:26 7994
- 产品价格:面议
- 发货地址:北京海淀 包装说明:不限
- 产品数量:9999.00 套产品规格:不限
- 信息编号:222731116公司编号:14832749
- 王经理 微信 18510103847
- 进入店铺 在线留言 QQ咨询 在线询价
ENERPLOT培训 正规代理
- 相关产品:
科学软件网是一个以引进国研软件,提供软件服务的营业网站,网站由北京天演融智软件有限公司创办,旨在为国内高校、科研院所和以研发为主的企业事业单位提供的科研软件及相关软件服务。截止目前,科学软件网已获得数百家国际软件公司正式授权,代理销售科研软件达一千余种,软件涵盖领域包括经管,仿真,地球地理,生物化学,工程科学,排版及网络管理等。同时,还提供培训、课程(包含34款软件,66门课程)、实验室解决方案和项目咨询等服务。
v_zero = [ (va+vb+vc)*1000 for va,vb,vc in zip(ph_a.data, ph_b.data, ph_c.data) ]
Once the desired signal has been created, it must be passed back to Enerplot for display in graphs. Since data can only be displayed from a channel in a datafile, we must create a new channel in the datafile for the newly created signal before it can be added to a graph. Add the following to the :
Earlier, we retrieved handles to 3 channels: ph_a, ph_b and ph_c. Each channel represents a series of values over a domain, time in this case. We can pull that data (the series of values) from Enerplot into Python by access the channels’ .data members. For instance, the first few samples from each of those channels:
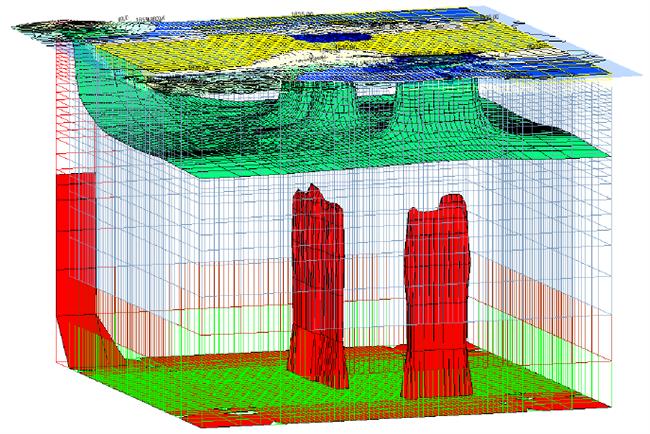
The length of the trace corresponds to the number of samples in the data file’s domain channel.
Using Python
Although any text editor which writes plain text files may be used to write python scripts, using an integrated development environment (IDE) will make developing the scripts easier and assist in debugging the scripts. Python 3.x comes bundled with such a tool, which is called IDLE.
科学软件网为全国大多数高校提供过产品或服务,销售和售后团队,确保您售后无忧!


